Understanding the importance of Western blot normalization
Western blotting is widely used to measure changes in protein expression between experimental conditions. To ensure that differences in signal reflect true biological changes rather than variations in sample loading, protein levels must be normalized using an internal reference.
Traditionally, housekeeping proteins such as actin or GAPDH are used as loading controls. However, their expression can be affected by experimental conditions, making them unreliable in some models. Total protein normalization provides an alternative approach by measuring the overall protein content of each sample using TGX Stain-Free gel (Bio-Rad), allowing researchers to obtain more accurate and reproducible quantification.
In this study, researchers investigated the effect of a beta-lactam antibiotic on the expression of the glutamate transporter GLT-1 in cultured astrocytes and evaluated protein expression using total protein normalization combined with Uvitec imaging systems.
Combining Stain-Free imaging and chemiluminescence detection
Following antibiotic treatment, astrocyte protein extracts were separated by electrophoresis using TGX Stain-Free gels (Bio-Rad). Before protein transfer, gels were activated using our Essential V6 UV imaging system, allowing visualization of total protein content in each lane.
After transfer and antibody detection, GLT-1 expression was analyzed by chemiluminescence using the Alliance range. The Uvitec software enabled researchers to quantify GLT-1 band intensity and normalize the signal against the corresponding total protein amount in each sample.
Visualizing total protein normalization
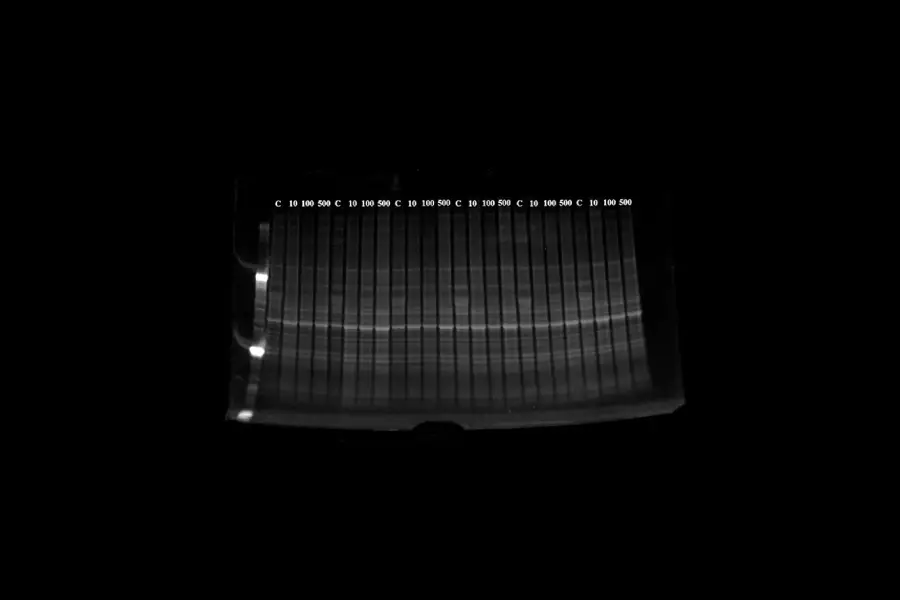
Following electrophoretic separation, the Stain-Free gel was activated using UV illumination to visualize total protein distribution across samples. C=control, 10=10µM, 100=100µM, 500=500µM of the beta-lactam antibiotic. After electrophoretic separation, the gel was directly placed on the UV-transilluminator (Essential V6 System, Uvitec Cambridge) and activated for 60 seconds.
Analyzing GLT-1 expression by chemiluminescence imaging

Western blot analysis revealed an increase in GLT-1 expression following beta-lactam antibiotic treatment. Samples are indicated upon each band. C=control, 10=10µM, 100=100µM, 500=500µM of the beta-lactam antibiotic. After electrophoretic separation, the gel was directly placed on the UV-transilluminator (Essential V6 System, Uvitec Cambridge) and activated for 60 seconds.
Conclusion
Total protein normalization using Stain-Free technology provides a reliable alternative to traditional housekeeping protein controls for Western blot analysis. By combining Stain-Free gel imaging with sensitive chemiluminescence detection, Uvitec imaging systems enabled accurate protein quantification and improved confidence in experimental results.
Frasca A., Albizzati E., Dept. of Medical Biotechnology and Translational Medicine, L.I.T.A., University of Milan, Italy

Application Specialist & Sales Export Engineer
